Box and Whiskers plot. How ?
I am trying to produce box and whiskers plots. Actually, not the plot in itself, but the values for the boxes, the whiskers and so on. An example of box and whiskers is the following
Browsing the net, I found that many sites just explain that a box plot is made according to the following recipe:
- Put the values in ascending order
- find the median (Q2), the first quartile (Q1) and the third quartile (Q3)
- make the box between the Q1 and Q3 values
- Put a line in the box where the median is
- make the whiskers including the lowest and highest values
This approach however does not represent outliers. A better recipe can be found on Wikipedia:
- Put the values in ascending order
- Find the median (Q2), the first quartile (Q1) and the third quartile (Q3)
- make the box between the Q1 and Q3 values
- Put a line in the box where the median is
- Calculate the Inter Quartile Range (IQR) as Q3-Q1
- Find the lower fence and the higher fence values as LowFence = Q1 -(1.5 * IQR) ; HiFence = Q3 + (1.5 * IQR)
- Mark any value below LowFence or above HiFence as outlier, and represent it with a circle
- Find the lowest value not marked as outlier, and make the low whisker using this value (NOT the LowFence value)
- Find the highest value not marked as outlier, and make the high whiskers using this value
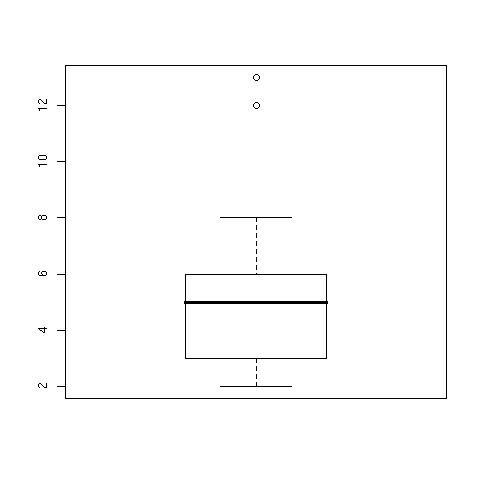
As an example, the following set of 15 values in R
> a=c(2,2,3,3,3,4,4,5,6,6,6,6,8,12,13)
have Q2 = 5, Q1 = 3 and Q3 = 6
> quantile(a)
  0%  25%  50%  75% 100%
   2    3    5    6   13
The IQR is therefore 6-3 = 3
> IQR(a)
[1] 3
The LowFence and HighFence values are therefore 3 - (3*1.5) = -1.5 and 6 + (3*1.5) = 10.5. Any value below LowFence (none) or above HiFence (12 and 13) are marked as outliers. The whiskers therefore are delimited by 2 and 8 (the lowest and highest values in the dataset that are not outliers). The result is the plot you see above. You can obtain the values for the box and whiskers as
> boxplot.stats(a)
$stats
[1] 2 3 5 6 8

$n
[1] 15

$conf
[1] 3.776137 6.223863

$out
[1] 12 13
Where stats contains the relevant values for the boxes and whiskers, as computed by hand above, out is the set of outliers, n is the number of values in the dataset and conf is a set of values to plot the hinges, not displayed in the plot above.