Exploring Mandelbrot parameter space - part 2
In a previous post we saw that graphing the Mandelbrot starting point contains fractal features as well. We want to plot these features, and at the same time increase resolution but reducing computational cost.
The first thing to note is that apparently, the plot is symmetric (but I don't have any strict proof of it) so technically only 1/4th of it can be computed, at least during the exploratory phase. The second optimization is that we are going to plot either a white pixel (if the corresponding Mandelbrot contains at least one white pixel) or a black pixel (the Mandelbrot contains no white pixels). This dramatically reduces the time needed, because when plotting each Mandelbrot, we can exit the generator as soon as a white pixel is found. White pixels are computationally expensive because the iterative procedure for that pixel must run up to the end, hence very whitey Mandelbrots, which are the majority, require a lot of these "up-to-end" iterations. This wastes a lot of time to compute something we know as soon as the first white pixel is found. On the other hand, Mandelbrots containing no white pixels have their iteration loop cut short for basically every pixel, making them faster to compute even if we have to run on each and every pixel of the Mandelbrot.
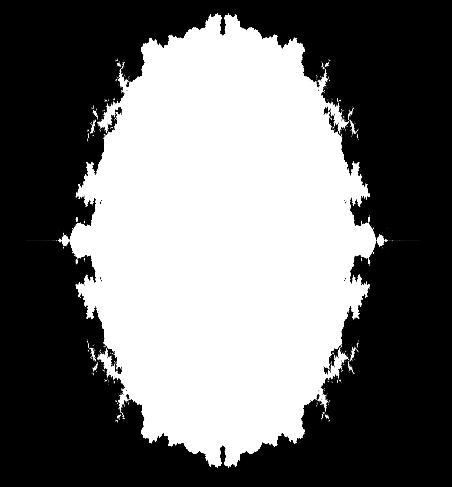
After these improvements, I ran two calculations. One using 100x100 Mandelbrots (on the left), another using smaller, 10x10 Mandelbrots (on the right)
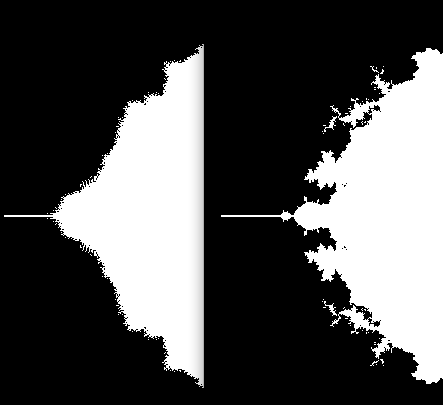
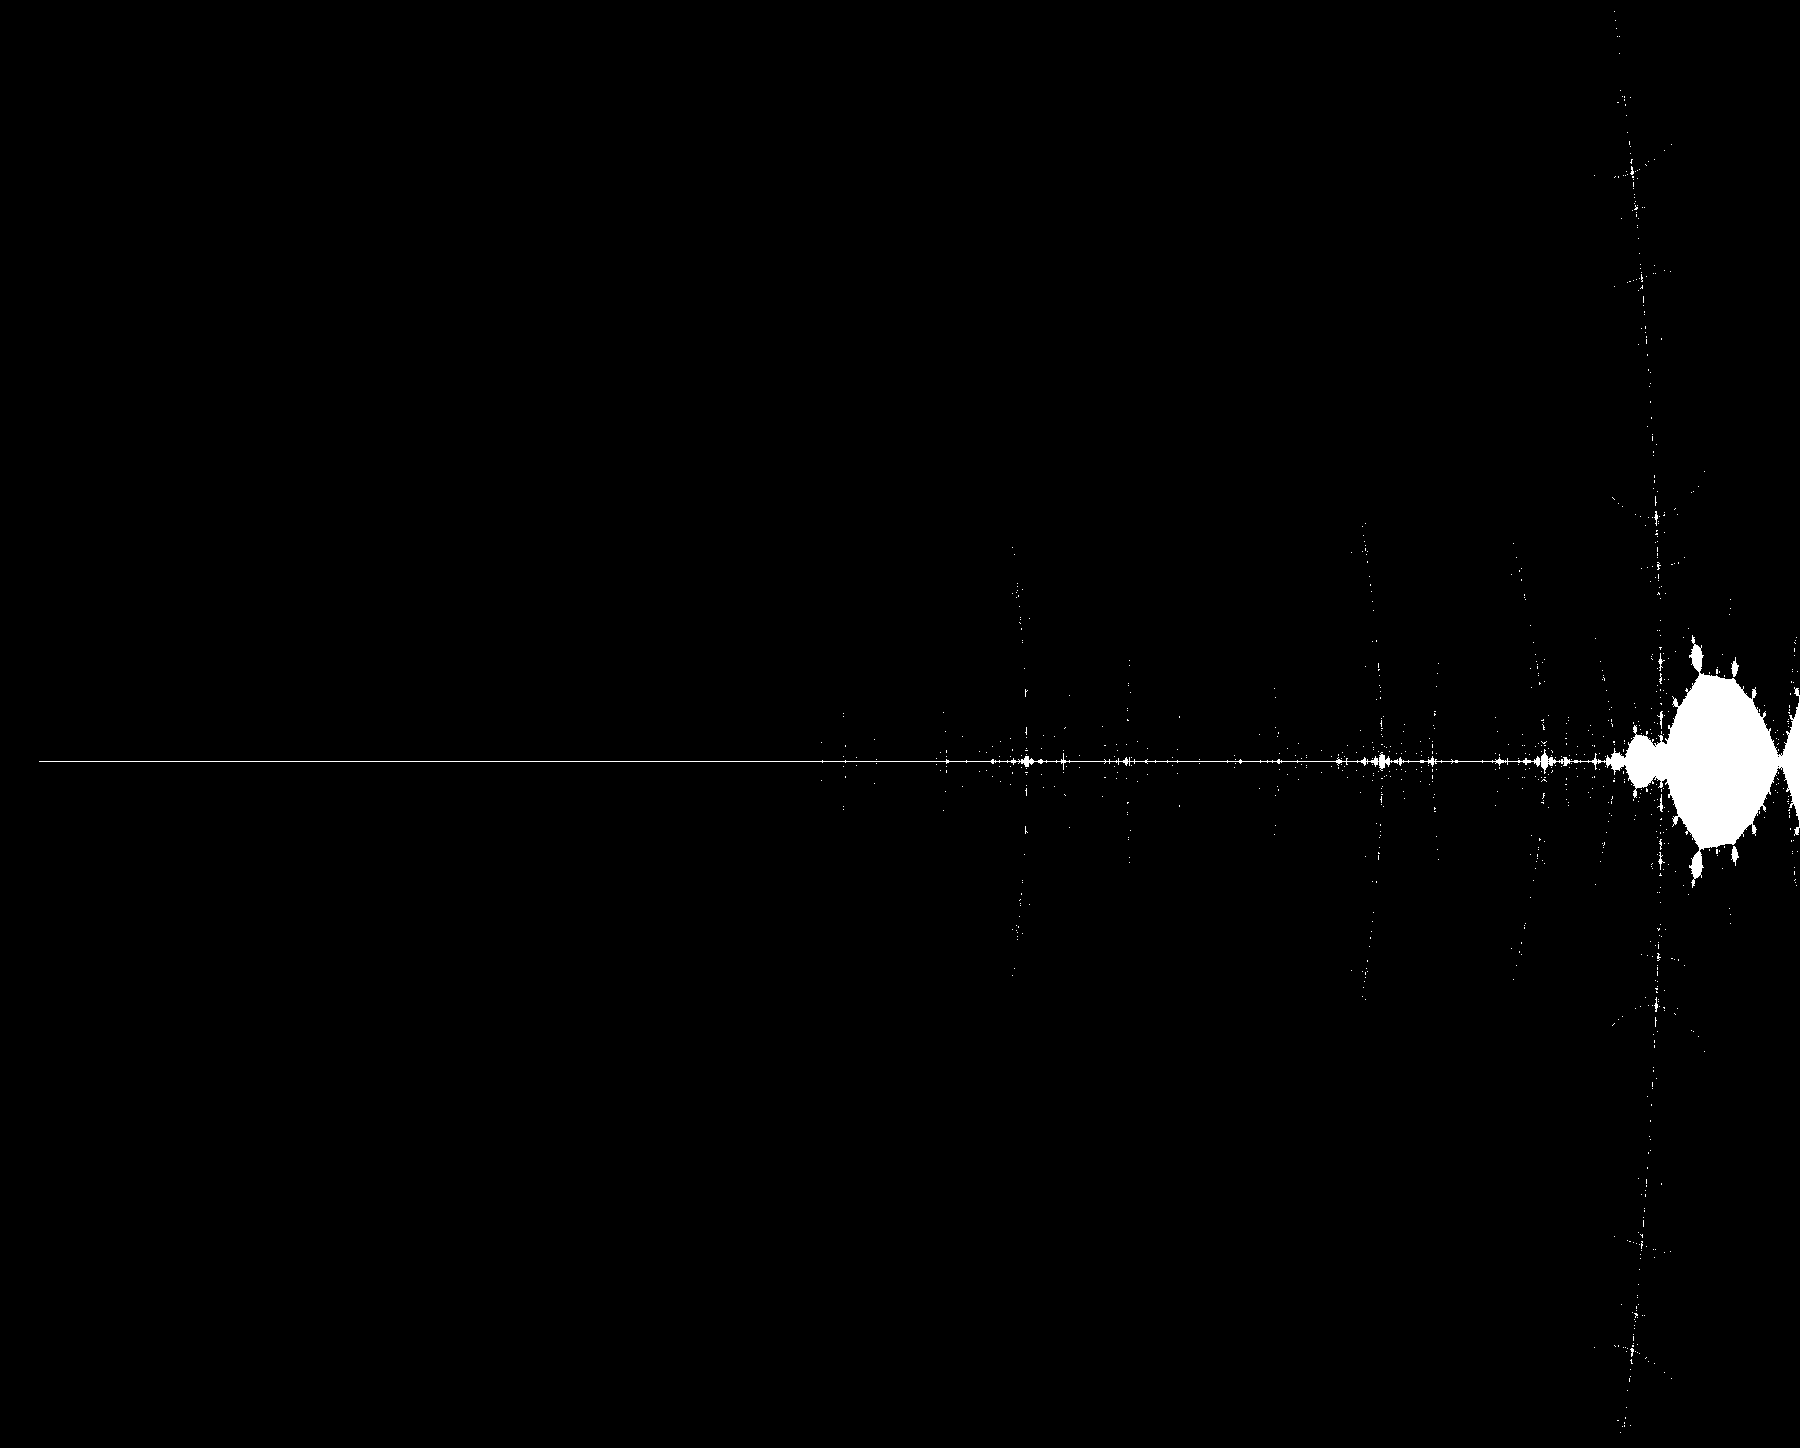
Apparently, the best visual results of the fractalization are obtained with smaller Mandelbrots. I am not really surprised, we already saw a similar situation in the previous post, where I plotted according to the number of white points. I have the feeling that increasing the resolution (the plots you see above are from 1000x1000 images) we would see better fractalization in the 100x100 case as well, but I would not bet on it. In any case, the 10x10 Mandelbrots are sufficient for our purpose, and they are much faster to compute. It's time to increase the resolution up to a staggering 900 Megapixel (30.000 x 30.000), on the full set, and see what happens. What you see took 10 full days to compute. I am not posting the full image, just a small low-resolution screen grab. The image is so big that is unreadable on Firefox, hangs Gimp and puts Preview.app in a very unpleasant situation. Here is the overview
As said previously, the Set appears to be symmetric. The fractal features we observe on the border are unique, in particular due to the existence of compartments with common behavior. Please note that all the terms I will use along this analysis are invented by me. Nothing of what you read is formal or agreed nomenclature. I will start from the left hand side of the border, and walk up to the top.
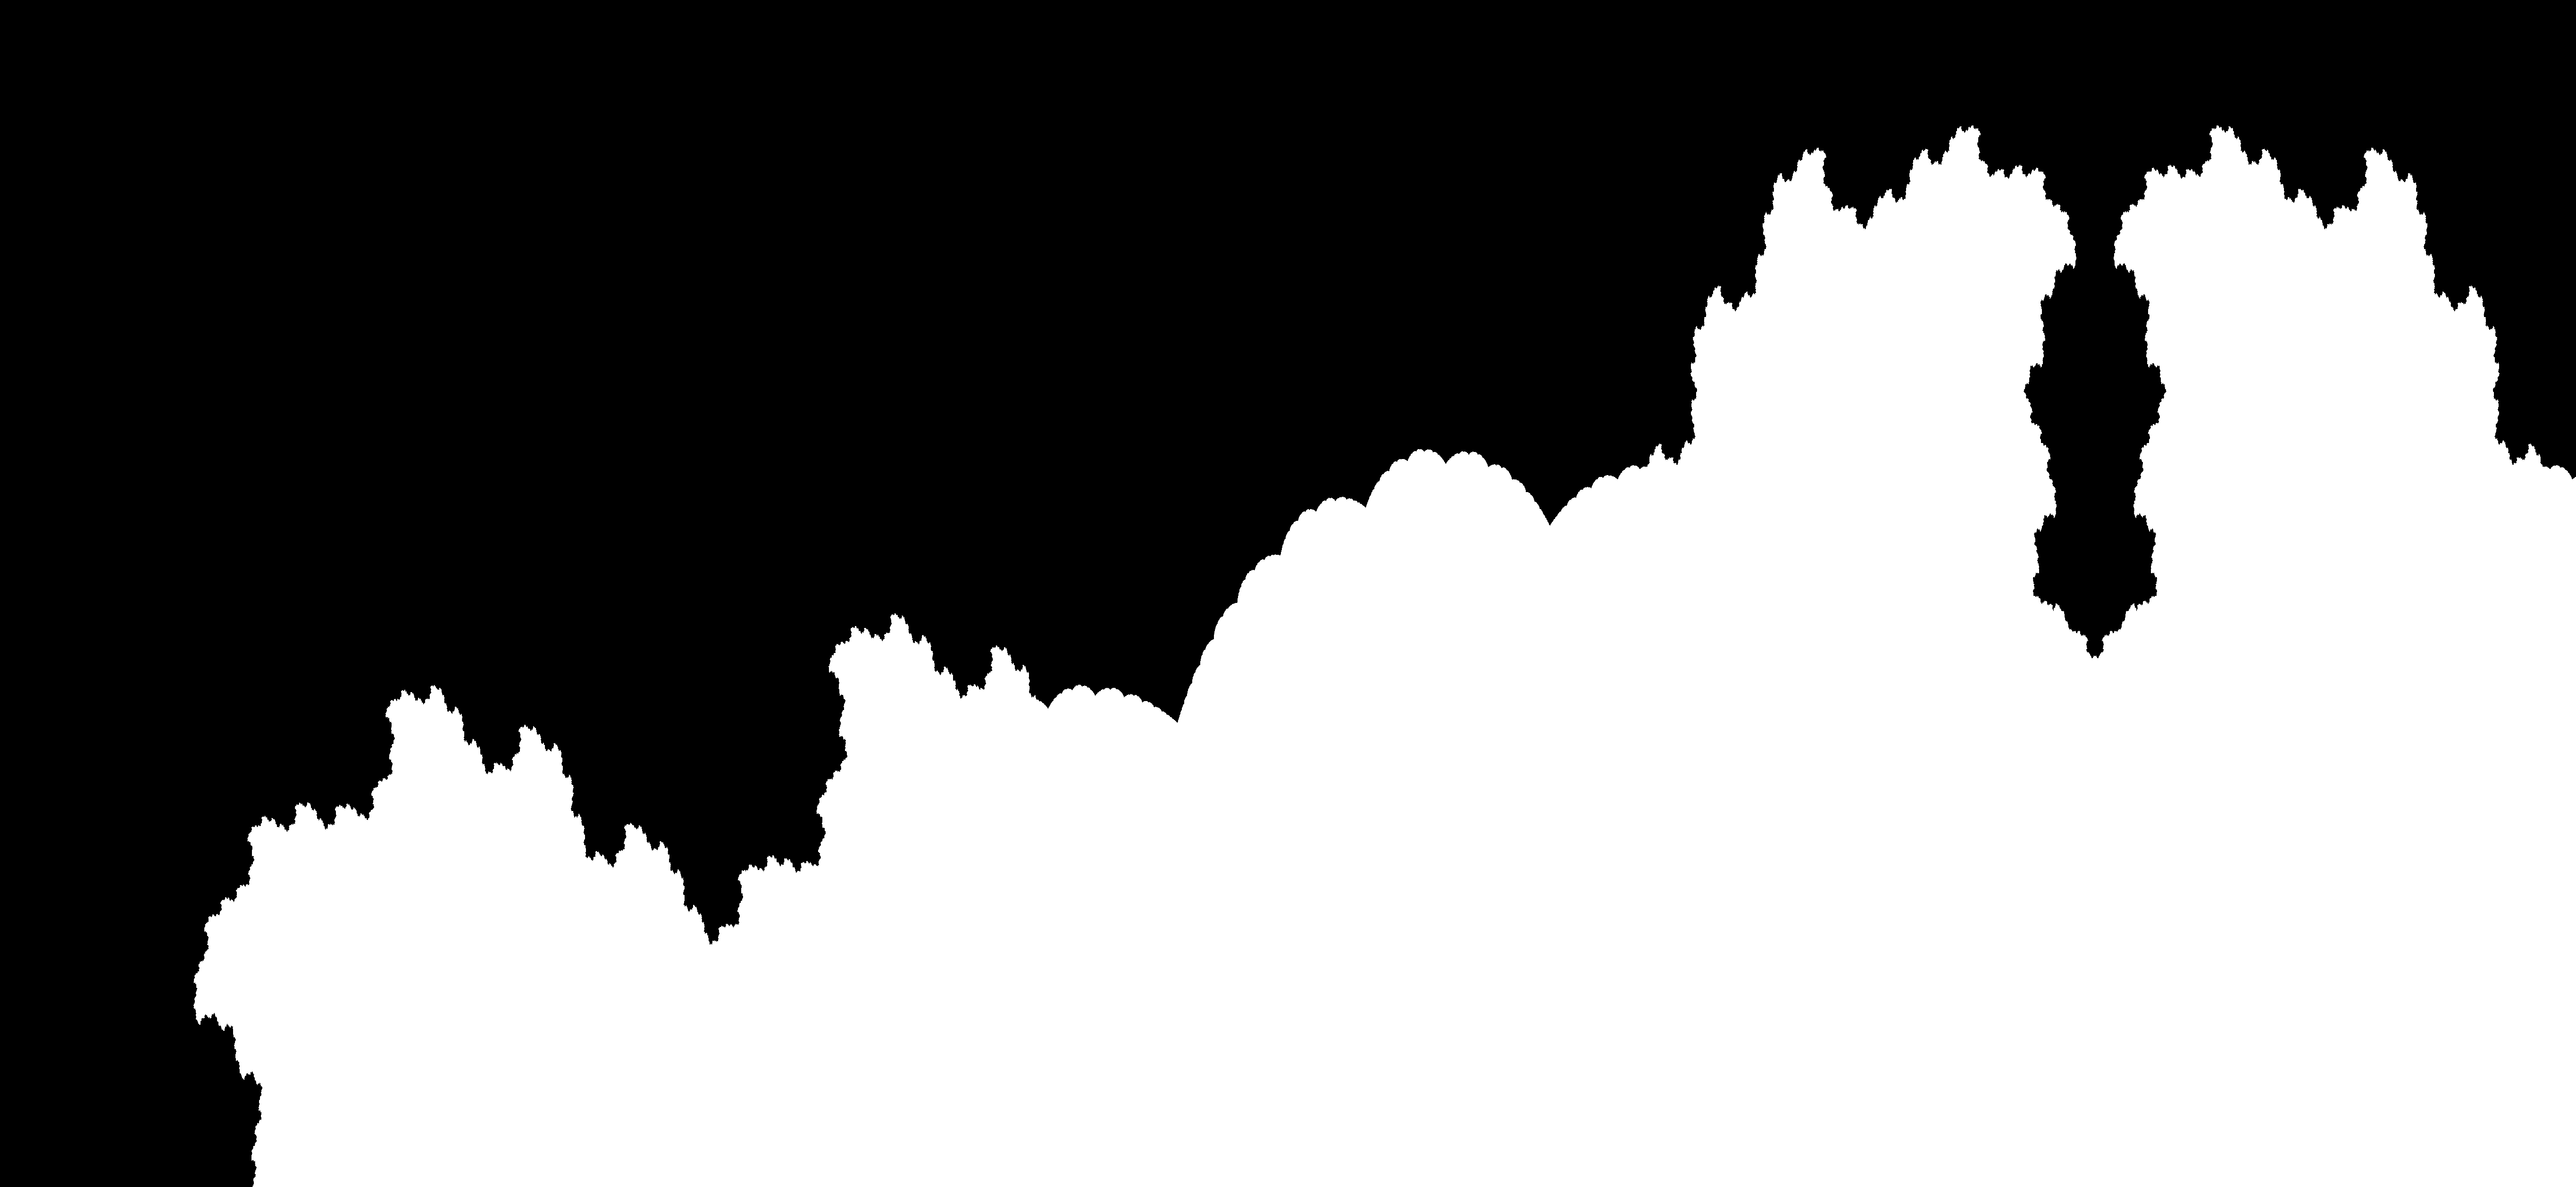
First, we have what I call a spike, a long, narrow line running horizontally and stretching away from the central bulge. This feature is found in the Mandelbrot set as well.
If you click the image and zoom in, you will notice a very interesting feature which also can be found in the Mandelbrot Set: lateral whiskers. These curved features intercept the spike in very bright areas. In traditional Mandelbrot, these areas are rich in self-similarity, as you can appreciate from this magnificent Mandelbrot image from Wikipedia. I don't know if similar self-similarity can be found in this Set as well, and the current resolution does not allow to infer any statement. According to what I understand from this answer Sam Nead gave at Math StackExchange, self-similarity is connected to what I assume is a mathematical property called renormalization. Due to my lack of expertise, I cannot explore this any further, but I encourage anyone competent on fractals to add comments, fix my mistakes and provide enlightenment on this regard.
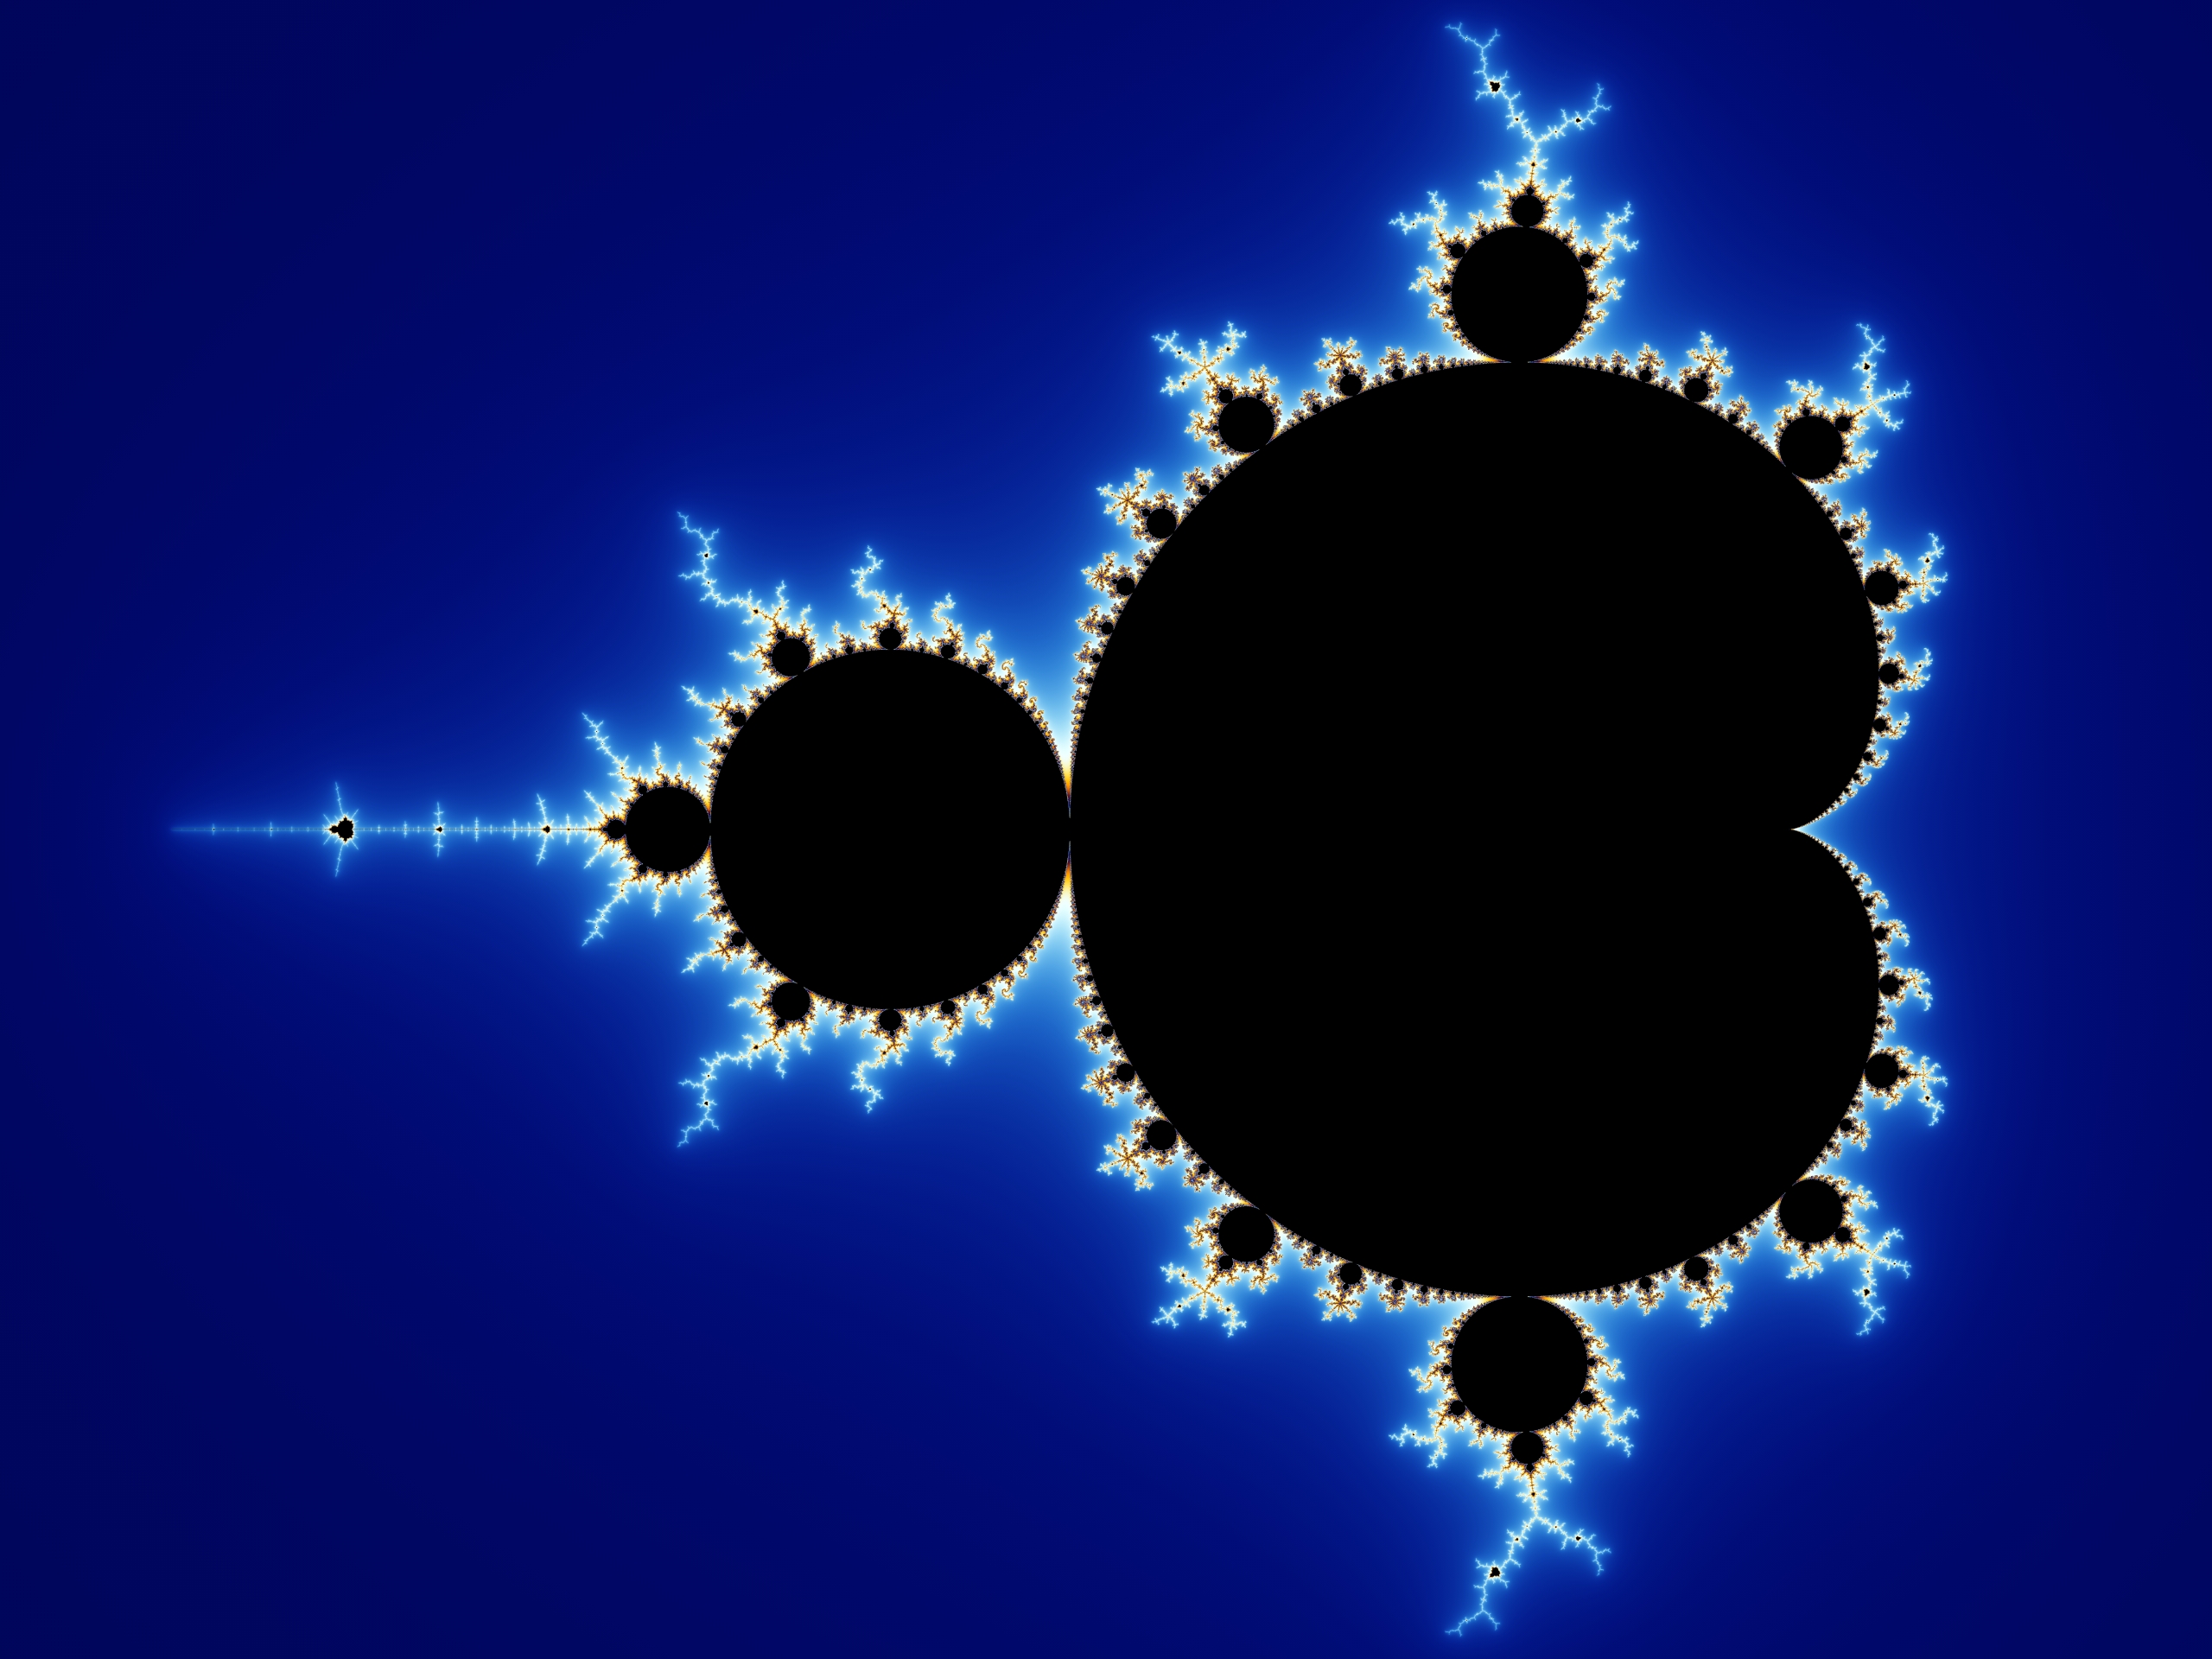
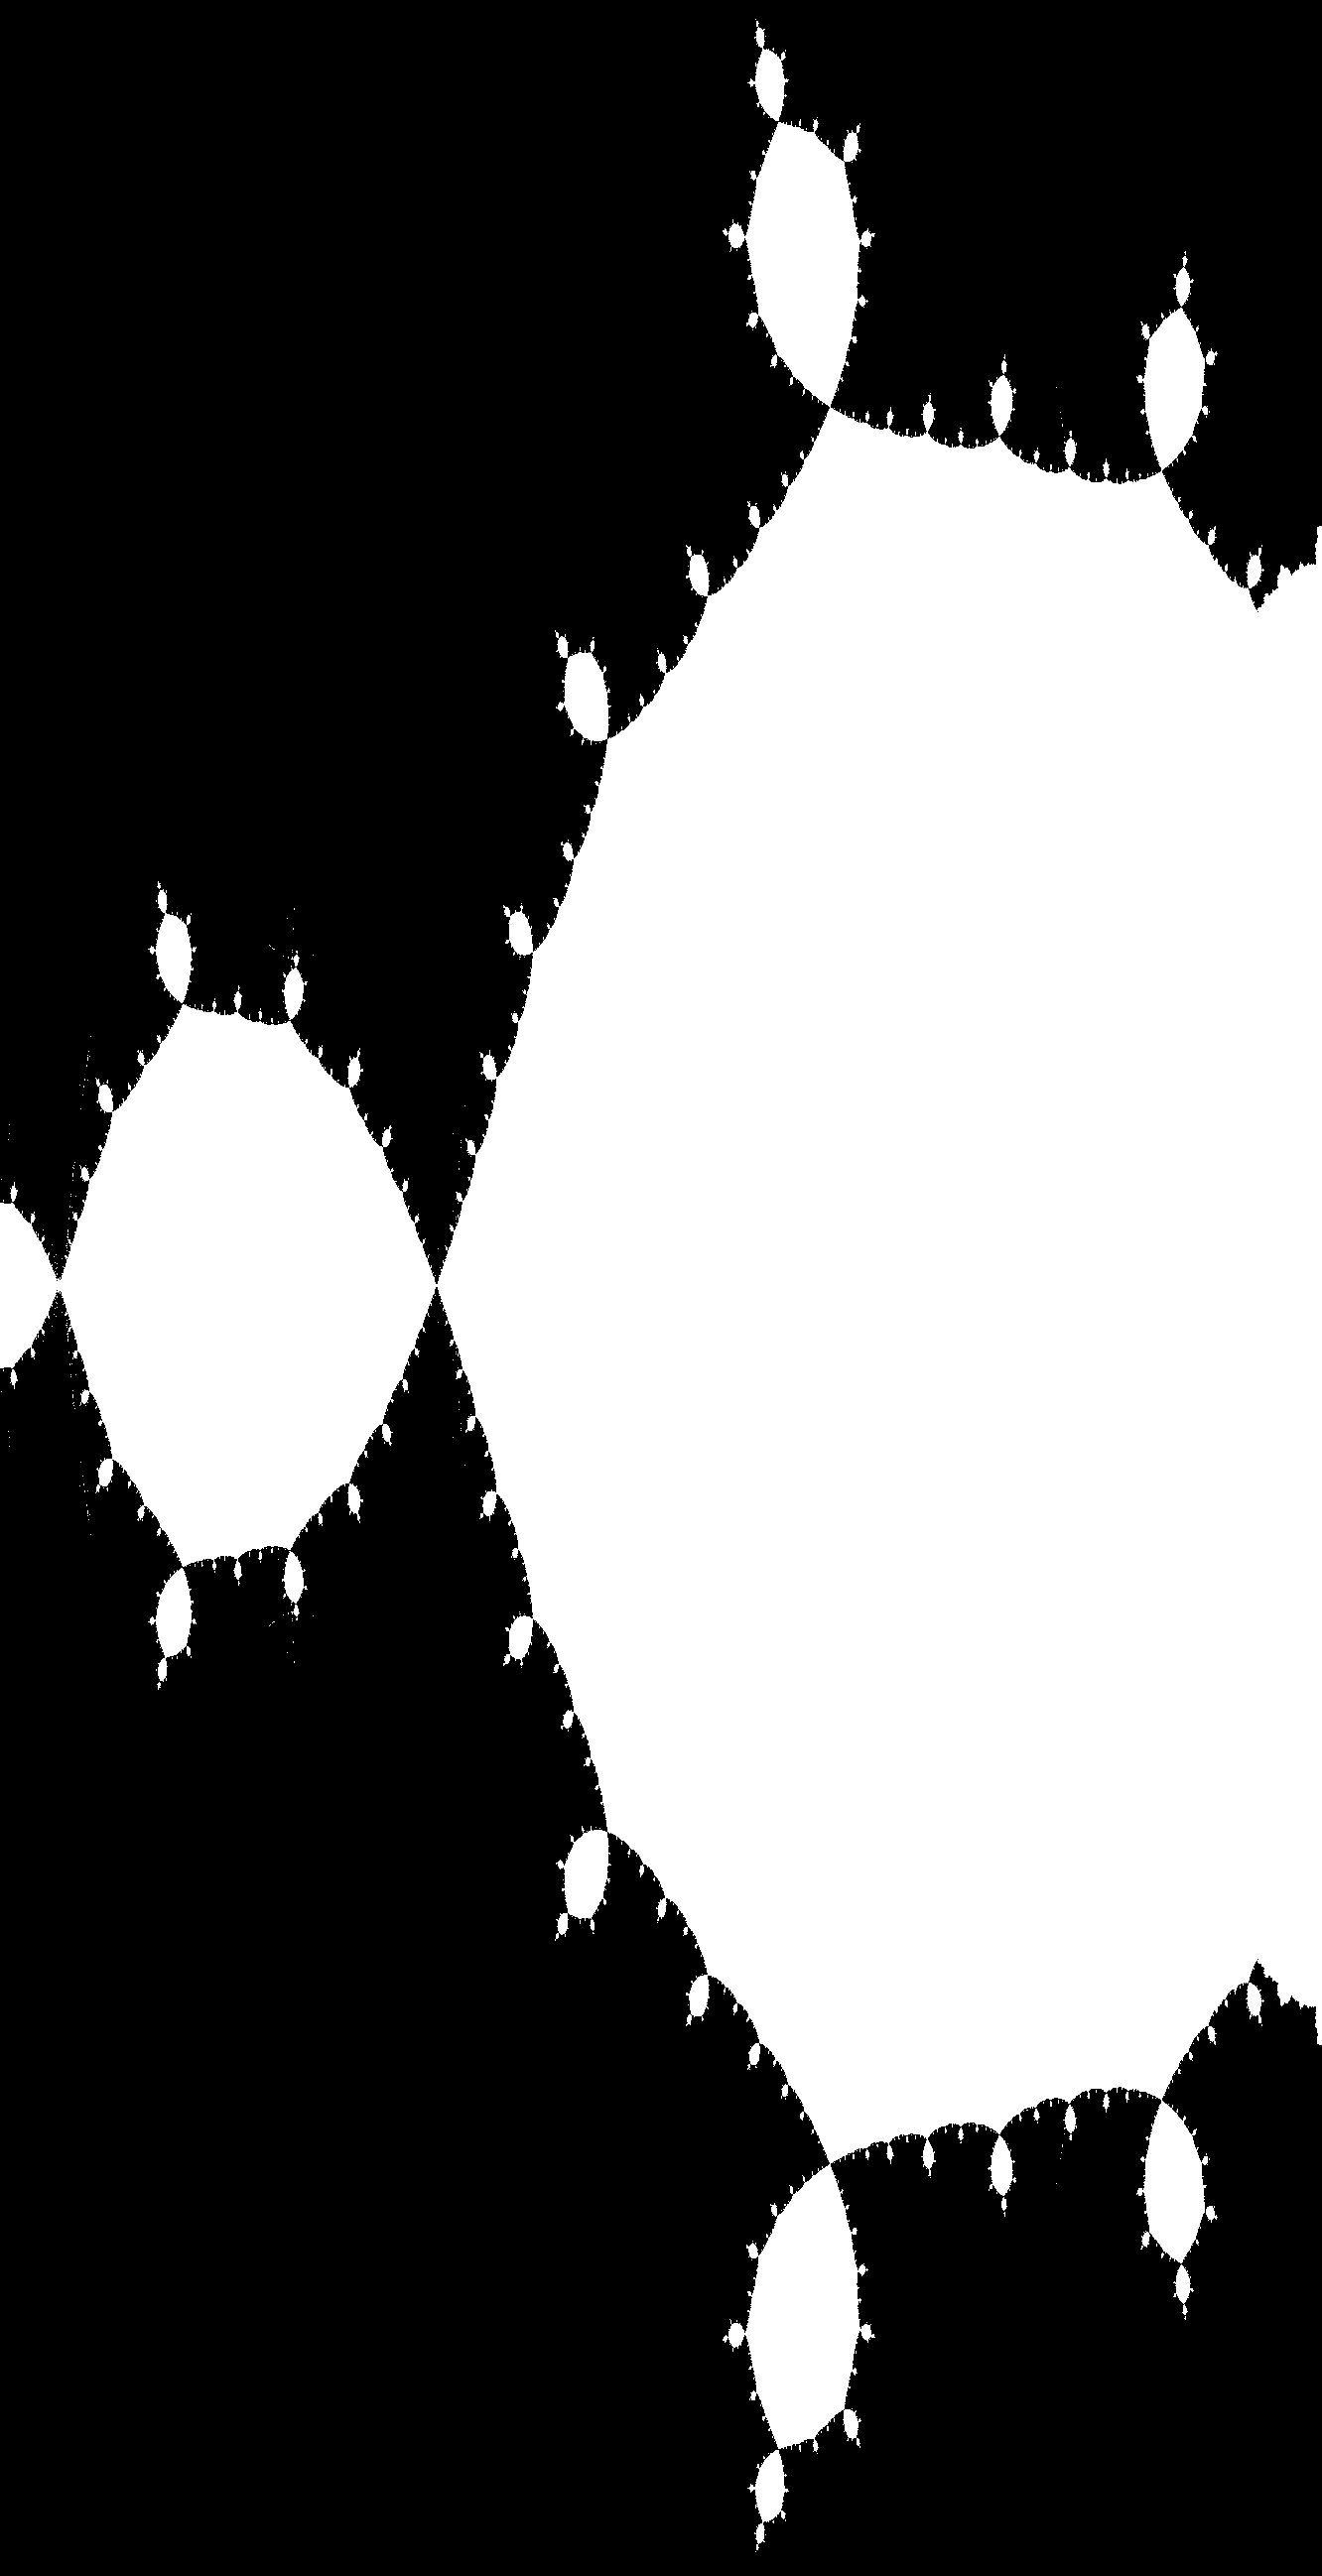
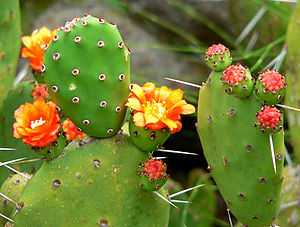
The next interesting feature is what I call the prickly pear zone. This zone has very sharp convergence points, and a large number of buds with similar shapes. The central zones look slightly polygonal in nature. I call it prickly pears due to its resemblance with the Opuntia (indian fig) plant, a cactus with characteristic fruits.
The sharp contact points recall similar features found in the Mandelbrot set, but on the other hand, the polygonal-like structure is not found. Mandelbrot, at least in its full, unzoomed representation, contains circular structures and the main cardioid.
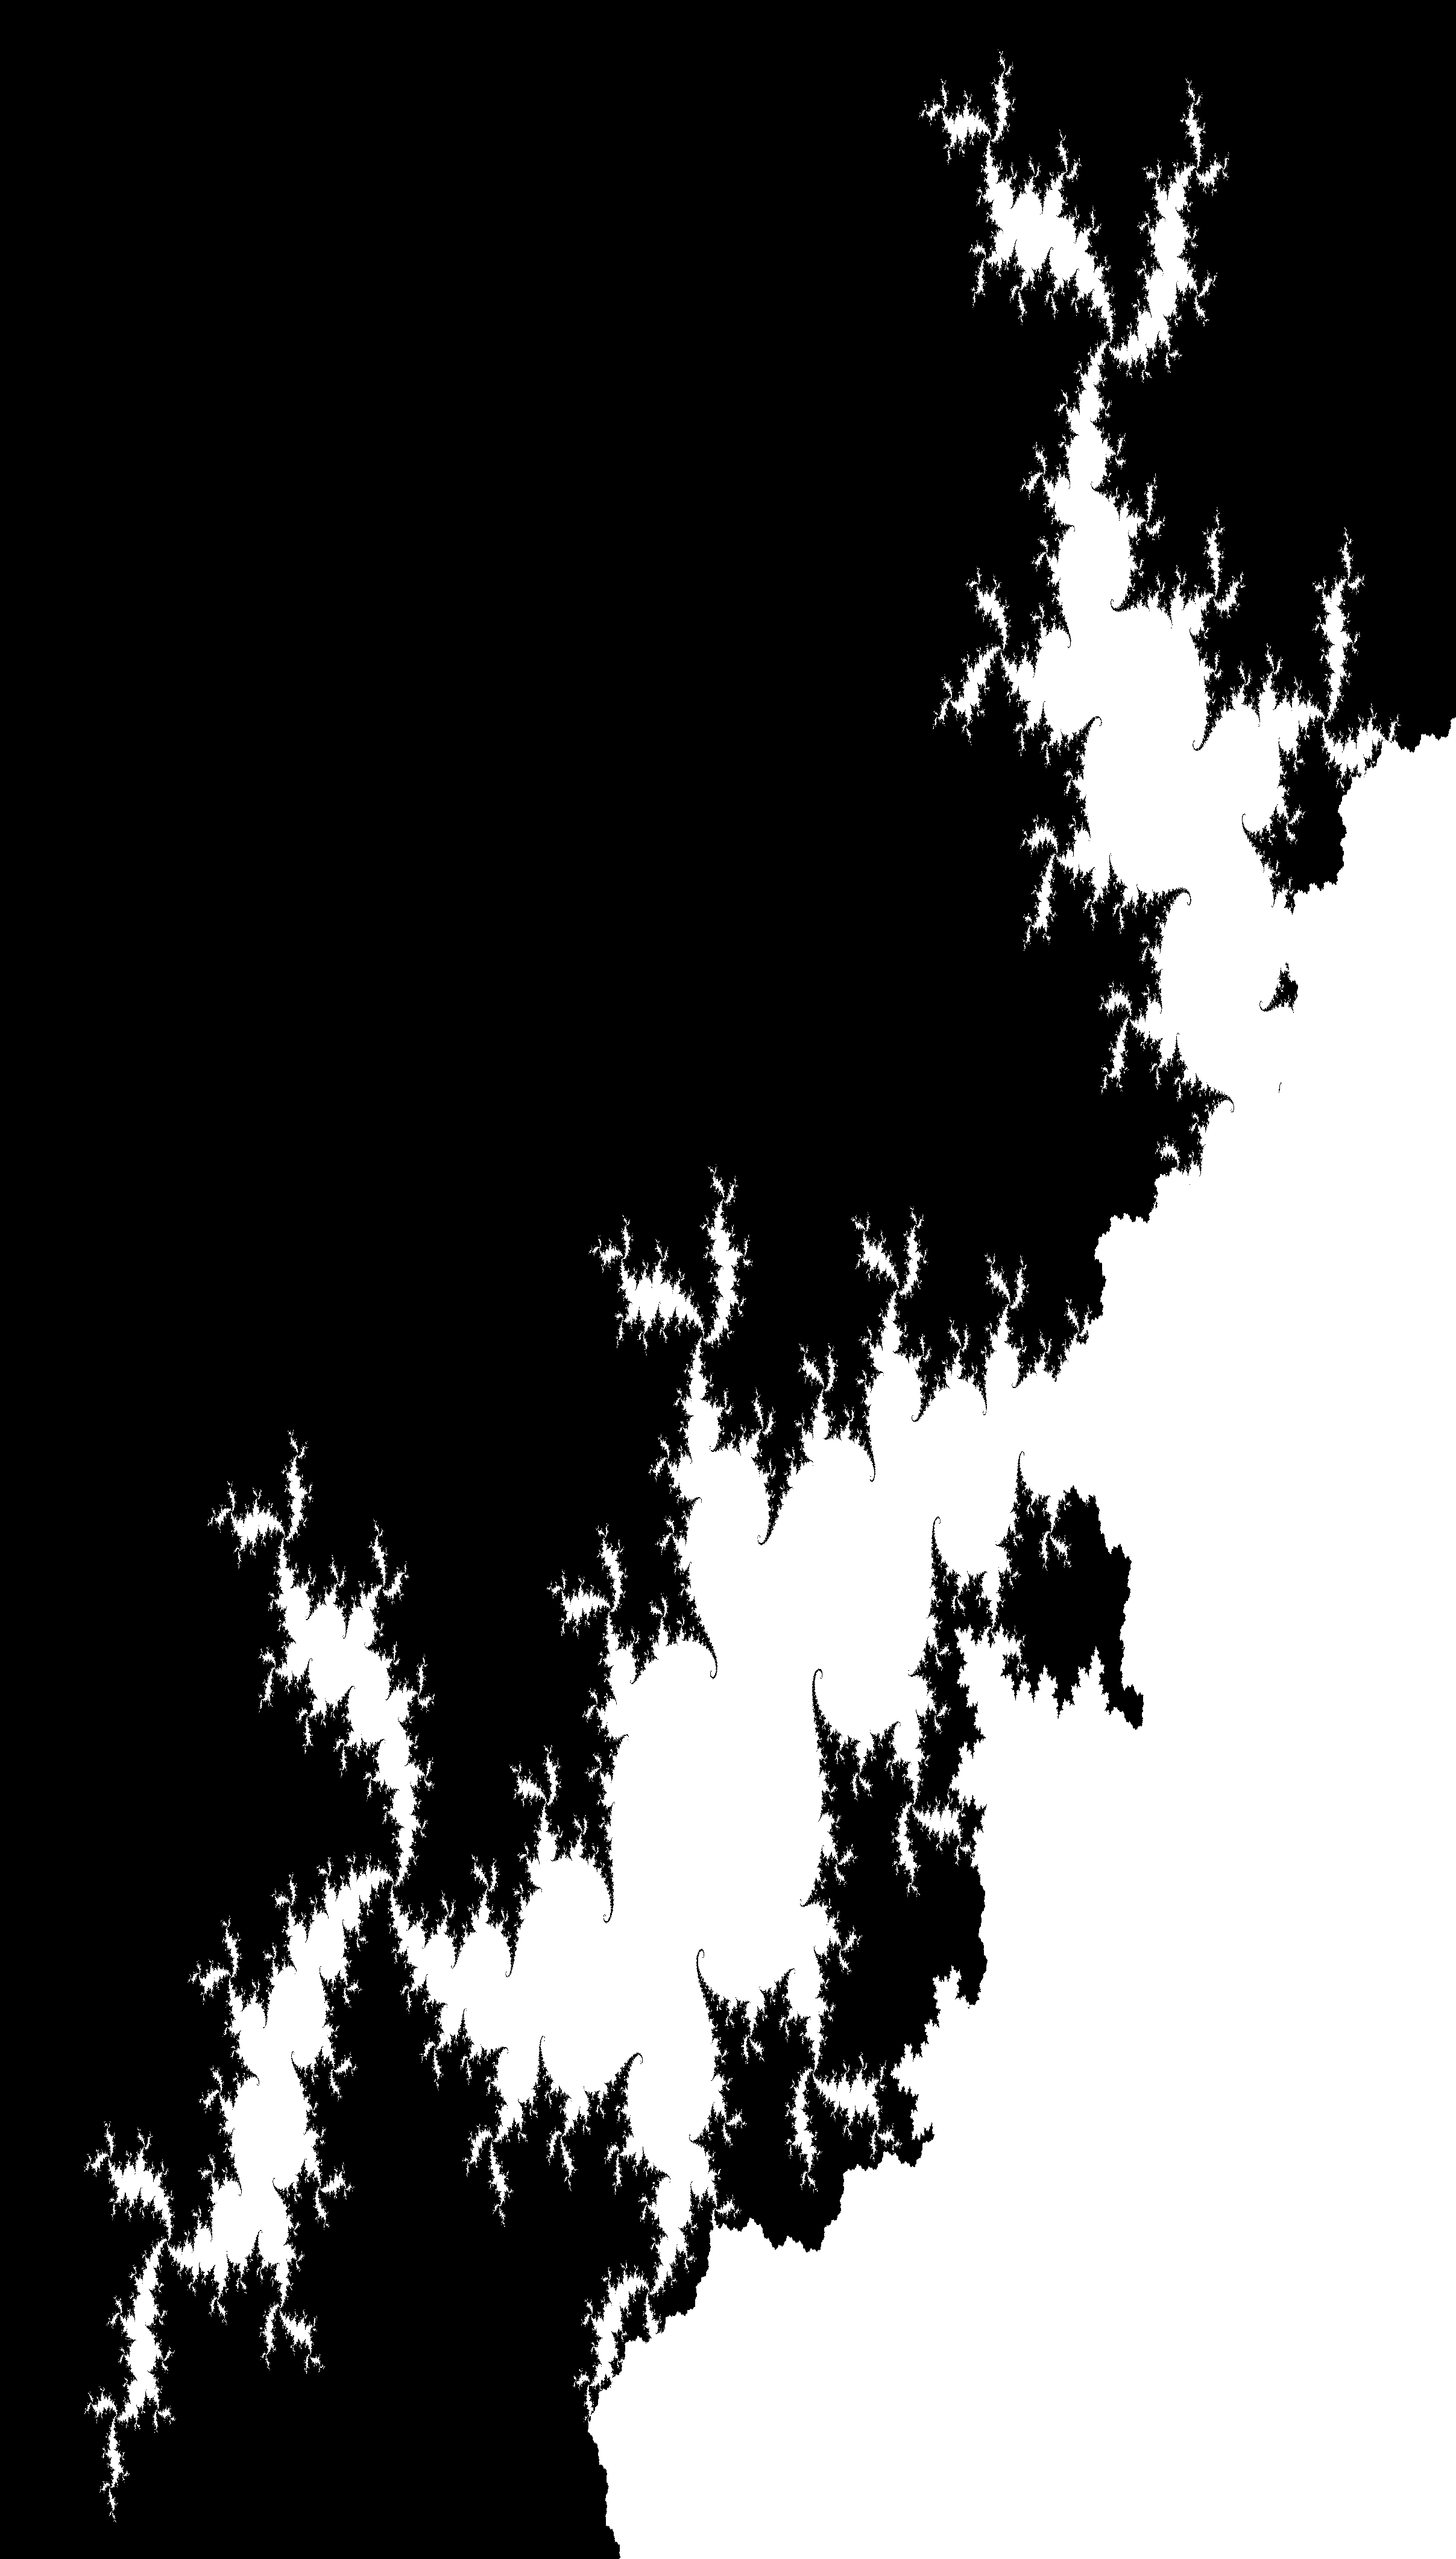
The third interesting feature is the tree foliage.

which appears as a relevant change from the repetitive, sharp-edged prickly pears area. On this regard, however, nothing beats the nervous, highly featured, strongly self-similar and spiraling behavior of the fuzzy worm. This area of the plot is incredibly featured and a real pleasure to zoom in.
After the fuzzy worm, we don't see any more spectacular features. The border becomes first rocky, then smooth then rocky again, and it's finally closed with a hole.
As usual, I cannot really say anything about the mathematical content of the task I performed and the features of the resulting fractal. However, it has been an incredibly interesting and fun exploration into a fascinating discipline. I hope you enjoyed this exploration, and feel free to leave comments if you want to add information or fix mistakes.