Image self consistency from xkcd
I love xkcd. A comic combining fun and math by definition has to be good and geeky and the author, Randall Munroe, is a real genius on this. The latest comic is pretty interesting

The image is self-descriptive, meaning that each graph represents information about the image itself. For example, the first panel contains a pie chart which says how many pixels are either white or black on the image. Clearly, the relative amount of black pixels in the image depends on the size of the slice of that piechart representing the amount of black pixels, a "chicken-egg" kind of problem. It is apparently difficult to obtain such image, because the plotted data must be consistent with themselves via the graphical representation. This kind of problems, where the solution depends on itself, is quite common in many scientific problems, and it's solved through self-consistency.
The trick is as follows: we start with a first, approximate solution, called a guess, and we apply a method that gives us a result depending on this guess. Then, we take this newly obtained result, and reapply the method again, to obtain a new result, and then again, and again, until, hopefully, the input and the output of the method are the same. When this occurs, we solved our problem via self-consistency. Of course, this convergence is not guaranteed to occur, but if it occurs, we found a solution (there could be more than one).
Let's see it in action in a simplified form. I wrote two small python programs. They use matplotlib and the Python Image Library. The first (called piechart.py) creates a pie chart from a given data input
import sys
from matplotlib import pyplot

white = int(sys.argv[1])
black = int(sys.argv[2])

pyplot.pie([white, black], colors=('w', 'k'))
pyplot.savefig(sys.argv[3], format="pdf")
If we call this program specifying two values (the absolute values are not important, as the pie chart shows relative amount), it draws the pie chart accordingly
python piechart.py 100 400 piechart_100w_400b.pdf
convert -geometry 210x158 piechart_100w_400b.pdf piechart_100w_400b.png
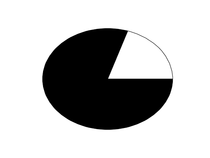
This creates a pie chart where white is 1/5 of the pie chart area and black is 4/5. Please note that due to a setup problem of my matplotlib I can only create pdf, so I convert the pdf into png of defined size, in our case, 210x158, using the convert program. The total size of the image is of course important, having an influence on the total number of pixels. I chose a good value for presentation purposes which guarantees quick convergence.
The second program is called imagedata.py and extracts size and number of white and black pixels from an image.
import sys

from PIL import Image

im = Image.open(sys.argv[1])
white = 0
black = 0
for i in im.getdata():
  if i == (255,255,255):
    white += 1
  else:
    # we assume black everything that is not white:
    black += 1
print im.size[0],im.size[1],white,black
If we run this program on the png image, it will tell us how many pixels are white, and how many are black.
$ python imagedata.py piechart_100w_400b.png
210 158 23988 9192
Of the 33.180 pixels defining the full image above (border included, not only the pie chart circle), 23988 are white (72%), and 9192 are black (28%). Hence the image is not representing itself: the plot represents our initial values of 20 % white and 80 % black.
Now we create a new image, in agreement with the iterative procedure, passing the most recently obtained values
python piechart.py 23988 9192 piechart_23988w_9192b.pdf
convert -geometry 210x158 piechart_23988w_9192b.pdf piechart_23988w_9192b.png
and repeat the process. This becomes tedious very soon, so I wrote a driver (driver.sh) to perform the process for me
# generates the starting guess
python piechart.py 100 400 iter_0.pdf
convert -geometry 210x158 iter_0.pdf iter_0.png

# iterative process
echo "step w   h  white black"
step=1
while true;
do
 data=`python imagedata.py iter_$(($step-1)).png`
 echo "$step - $data"
 python piechart.py `echo $data|awk '{print $3}'` `echo $data|awk '{print $4}'`  iter_$step.pdf
 convert -geometry 210x158 iter_$step.pdf iter_$step.png
 step=$(($step+1))
done
If we run it, we immediately see a very interesting result
step w   h  white black
1 - 210 158 23988 9192
2 - 210 158 29075 4105
3 - 210 158 30551 2629
4 - 210 158 30977 2203
5 - 210 158 31108 2072
6 - 210 158 31158 2022
7 - 210 158 31164 2016
8 - 210 158 31169 2011
9 - 210 158 31172 2008
10 - 210 158 31172 2008
11 - 210 158 31172 2008
12 - 210 158 31172 2008
The number of black pixels decreases, and the number of white ones increases. At every step, the image slightly changes, until it reaches a point where it does not change anymore: it achieved self-consistency, and it is representing itself. This is a movie of the various steps until convergence

What if we started from the other direction, namely, with a guess containing zero as the number of black pixels? The result would have been the same
1 - 210 158 31750 1430
2 - 210 158 31320 1860
3 - 210 158 31221 1959
4 - 210 158 31184 1996
5 - 210 158 31178 2002
6 - 210 158 31174 2006
7 - 210 158 31172 2008
8 - 210 158 31172 2008
9 - 210 158 31172 2008
Again, even with a different starting guess, we obtain the same result, here depicted as a movie
I hope this gave a brief explanation on how Randall achieved the self-consistent image. His case was more complex, having three plots. Also, the comic is scribbled, so either he drew it by hand, approximating the computed result, or he performed some scribble-like transformation preserving the pixel count. I assume it is the former.